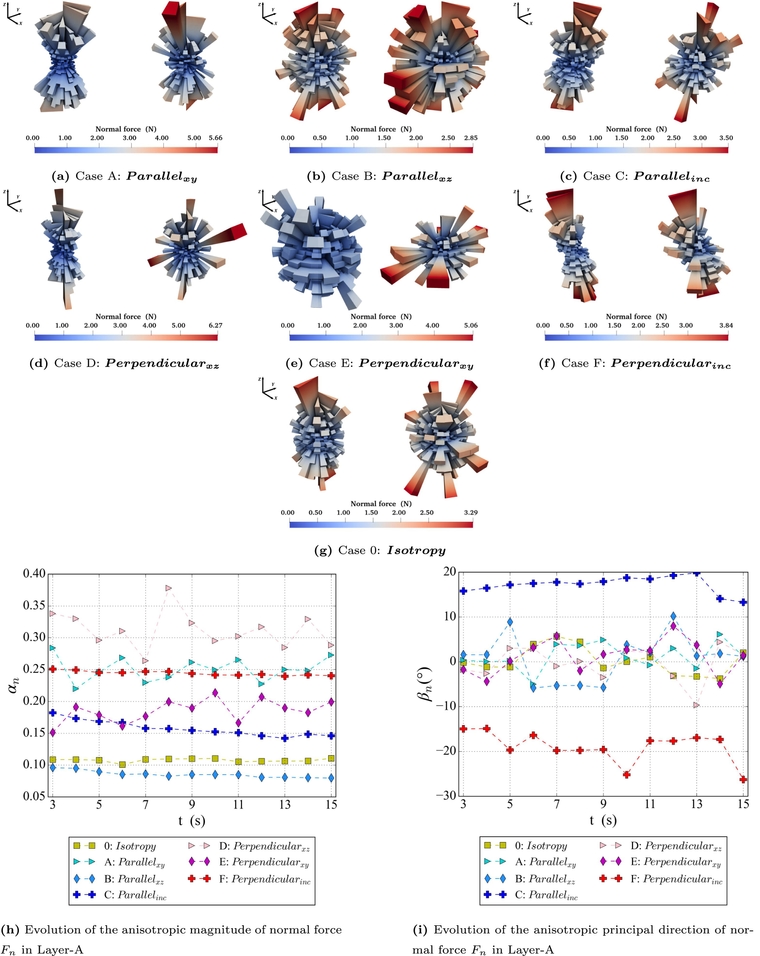
请问颗粒堆积体受力各向异性分布3D玫瑰图是怎么画的呢?
-
论文里面提到3D 玫瑰图是用来说明各向异性分布以及各向异性大小和主方向的。这些柱状图好像都是对称的,每个柱子的高度应该是这个方向的平均力的大小,颜色是根据数值在柱子不同高度处分别着色。(https://doi.org/10.1016/j.compgeo.2023.105692)

论文里面提到3D 玫瑰图是用来说明各向异性分布以及各向异性大小和主方向的。这些柱状图好像都是对称的,每个柱子的高度应该是这个方向的平均力的大小,颜色是根据数值在柱子不同高度处分别着色。(https://doi.org/10.1016/j.compgeo.2023.105692)
