python进行OpenFOAM流场后处理
-
https://fluidfoam.readthedocs.io/en/latest/
我一直都是用这个包来读OpenFOAM cell的数据来做后处理的,非常好用 -
@李东岳 是的,我当时不清楚该怎么做来用python处理整个流场数据,最后是用paraview导入tecplot数据,然后导出成csv等方便读取数据的格式,用python进行处理。因为tecplot数据结构是分块的,而csv等格式是坐标点对应物理量的形式,方便读取。
第二个可能对大家有用的地方在于:有时候tecplot数据导入paraview会一直卡顿,无法完全显示,需要删掉一些符号:
• X, Y and Z array headers MUST NOT have other characters like [mm]. It must be simply “x”, “y” and “z”.Paraview also accepts this: “Z, mm” and this “x/c” • This parameter is not allowed by Paraview (it must be deleted from the file): “ZONETYPE=…” • “STRANDID” and “SOLUTION TIME” are currently unsupported by Paraview but they can be left in the file (it gives only a warning message) • Comments are allowed by using “#” (like Python)我当时是删除了ZONETYPE, 才能导入paraview的。
-
@chszkc 感谢分享,在尝试使用这个包的过程中遇到点小麻烦,向您请教。
首先,我的计算域是这样的:
我尝试画出温度等值线图,代码如下
#%%
from fluidfoam import readmesh
sol = './T293/massFlowRate0.412'
x, y, z = readmesh(sol)
from fluidfoam import readscalar

timename = 'latestTime'
T = readscalar(sol, timename, 'T')
# %%
import numpy as np
import matplotlib.pyplot as plt

# Define plot parameters
fig, ax = plt.subplots(figsize=(7, 3), dpi=100)
plt.rcParams.update({'font.size': 10})
plt.xlabel('x')
plt.ylabel('y')
# Plots the contour of sediment concentration
levels = np.arange(30, 300, 10)

plt.tricontourf(x, y, T, cmap=plt.cm.Reds, levels=levels)
结果却是

请问您有类似经历吗
先谢谢您 -
代码分两个文件,一个读数据,一个绘制。
readData.py
from paraview.simple import *

from pathlib import Path
import sys

from paraview.vtk.numpy_interface import dataset_adapter as dsa

# CaseType: 0 = decomposed case, 1 = reconstructed case.
reader = OpenFOAMReader(FileName="PEE.foam", CaseType=0)
if reader:
    print("Successful read.")
else:
    print("Failed read.")

time = reader.TimestepValues
# print(time)

argList = sys.argv
# print(argList)

try:
    timeIndex = argList.index('-time_') + 1
    timeI = float(argList[timeIndex])
except ValueError:
    print('ValueError: undefined time parameter.')
    exit()

UpdatePipeline(time=timeI)

data = paraview.servermanager.Fetch(reader)
data = dsa.WrapDataObject(data)

slicer = Slice(Input=reader, SliceType="Plane", Triangulatetheslice=False)
slicer.SliceType.Origin = [0, 5.5, 0]
slicer.SliceType.Normal = [0, 1, 0]

Path("slice").mkdir(parents=True, exist_ok=True)
SaveData("/Volumes/RAM Disk/slicePlane_%.2f.e" % timeI, slicer)
print('Successful write.')
plotData.py
import meshio
import numpy as np

import matplotlib.pyplot as plt
import matplotlib.tri as tri

import os
#from matplotlib import ticker, cm

plt.rcParams.update({
    # "text.usetex": True,
    "font.family": "serif",
    "font.serif": ['SimSun'],
    # "axes.unicode_minus": False,
    "mathtext.fontset": "stix",
    "font.size": 16,
    "figure.figsize": (12, 5)})

ticklabel_style = {"fontname": "Times New Roman", "fontsize": 14}

b = 10

os.system('pvpython readData.py -time_ 10')

mesh = meshio.read('/Volumes/RAM Disk/slicePlane_%.2f.e' % b)
os.system('rm -r "/Volumes/RAM Disk/slicePlane_%.2f.e"' % b)

logData = np.where(mesh.point_data['driftDensity'] <
                   1e-12, -12., np.log10(mesh.point_data['driftDensity']))
fig, ax = plt.subplots()
ax.set_aspect('equal')

cell_0 = mesh.cells[0].data[:, :3]
print(mesh.cells[0].data[:, 2:])
print(mesh.cells[0].data[:, 0])
cell_1 = np.concatenate(
    (mesh.cells[0].data[:, 2:], mesh.cells[0].data[:, [0]]), axis=1)
cell = np.concatenate((cell_0, cell_1), axis=0)

triang = tri.Triangulation(mesh.points[:, 0], mesh.points[:, 2], cell)
#triang = tri.Triangulation(mesh.points[:,0], mesh.points[:,2])
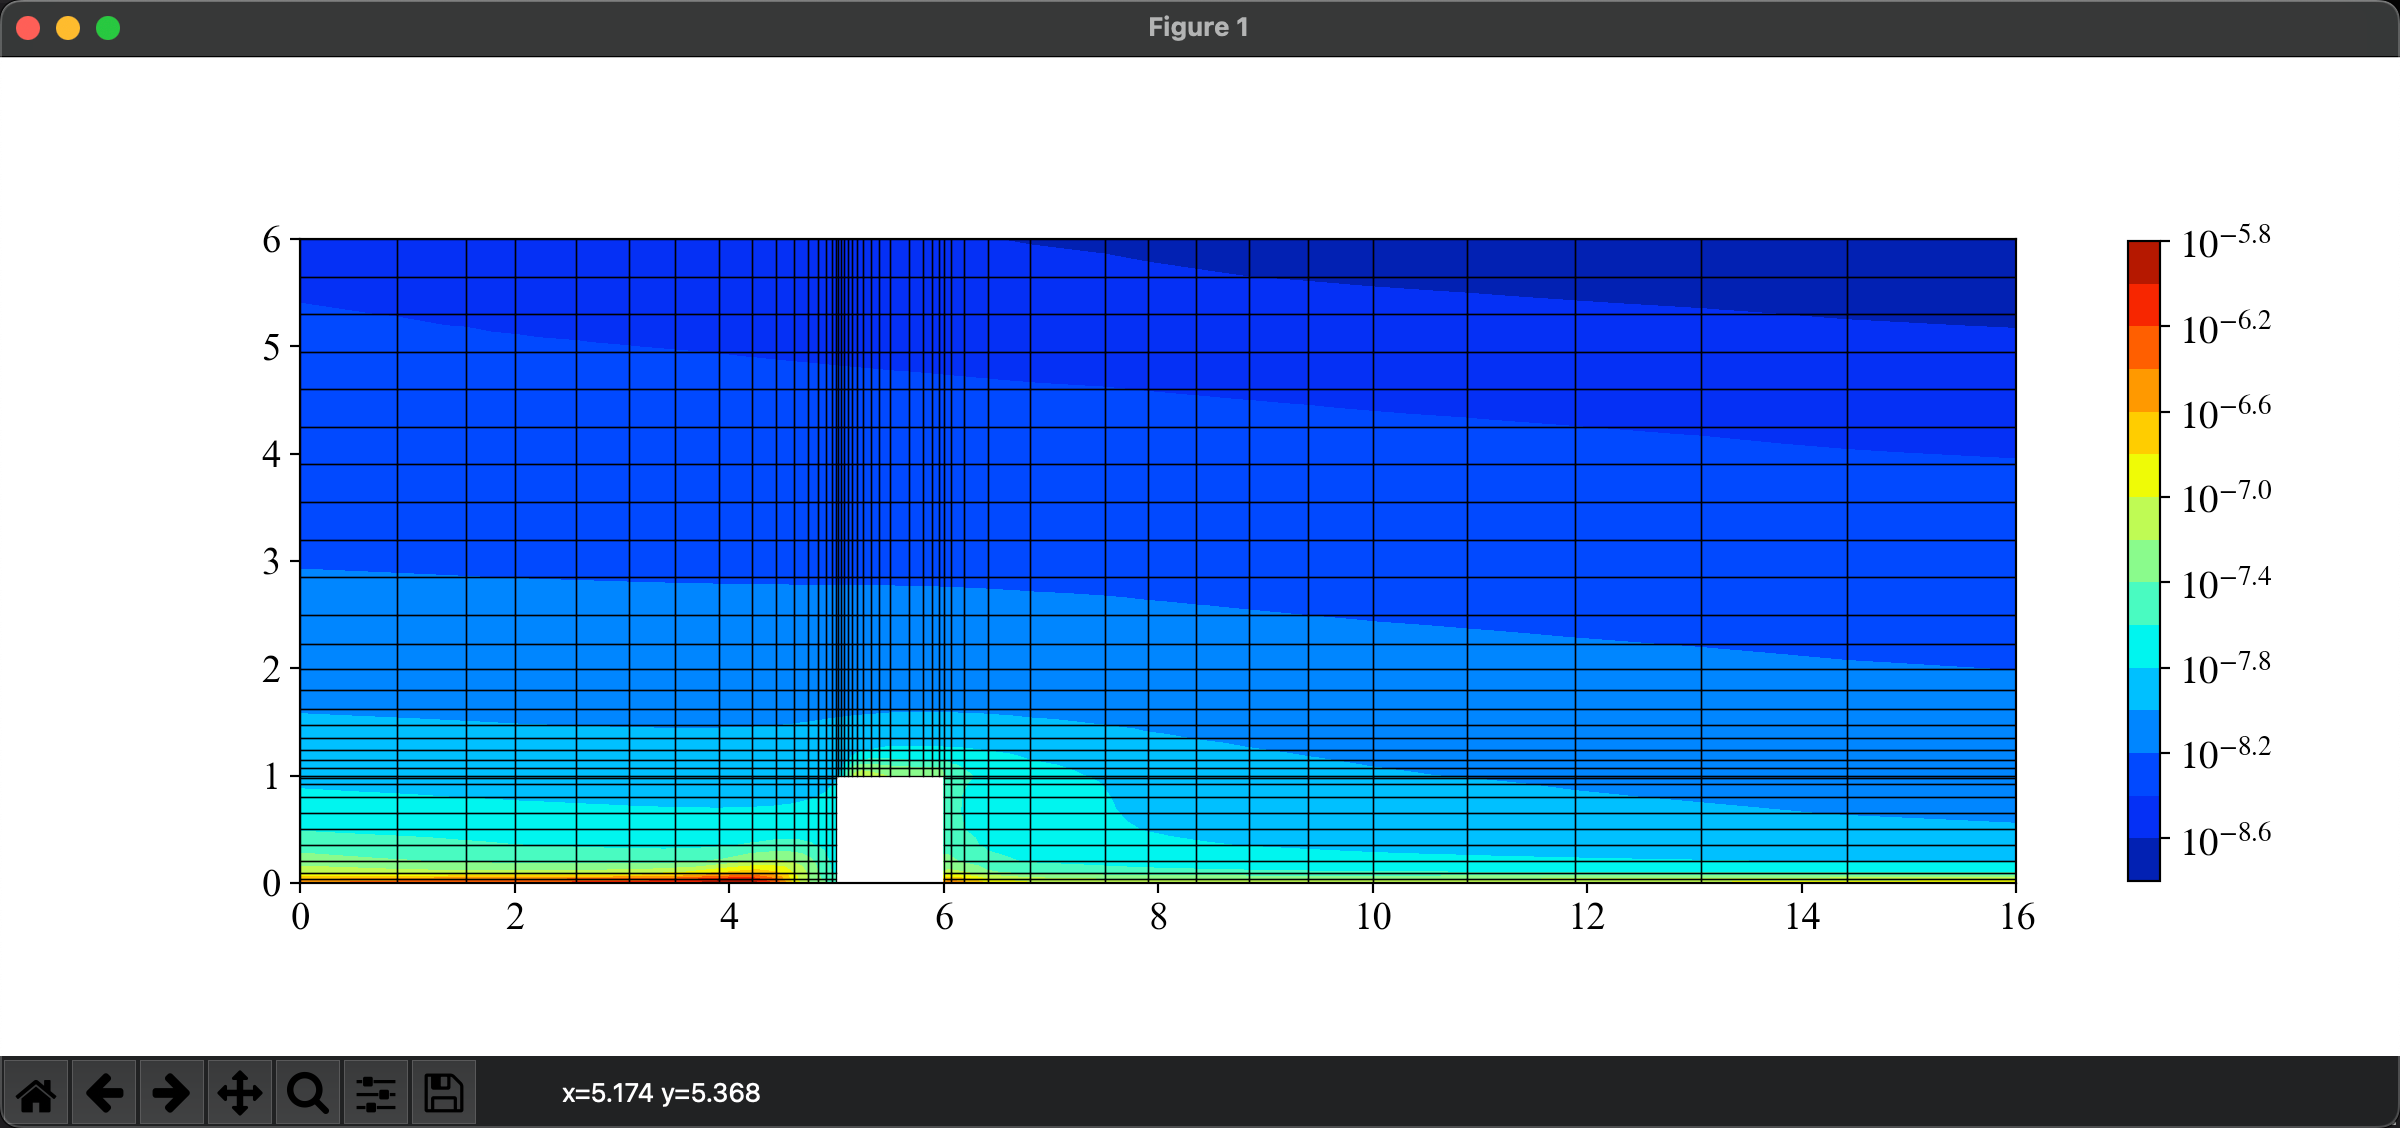
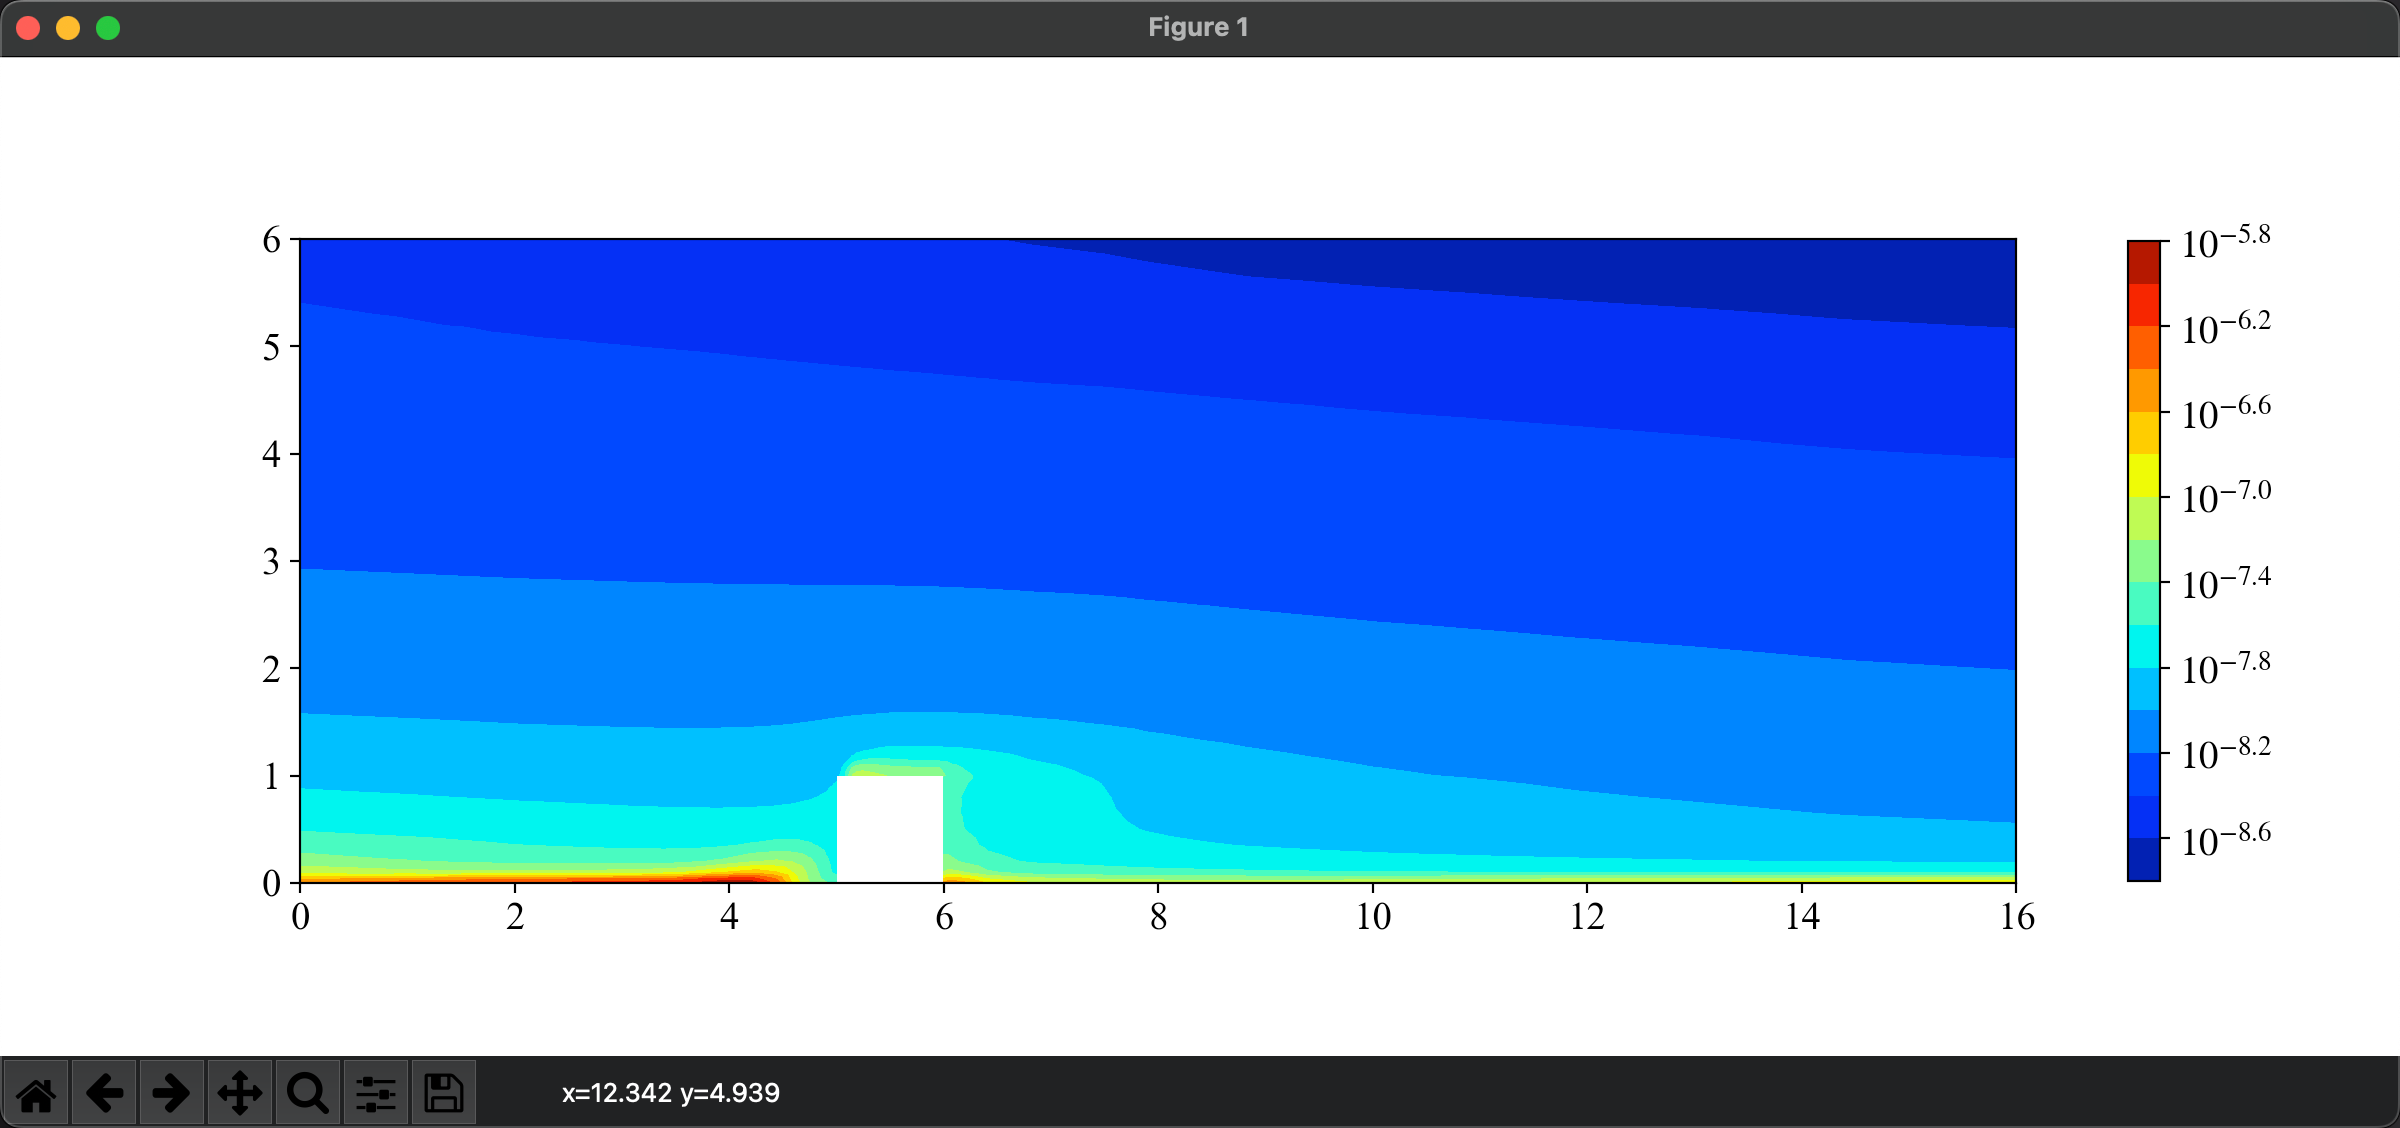
tpc = ax.tricontourf(triang, logData, cmap='jet', levels=16)
#ax.triplot(triang, 'k-', linewidth=0.5)

for cellI in cell:
    ax.plot(mesh.points[:, 0][cellI], mesh.points[:, 2][cellI],'k-', linewidth=0.5)

cbar = fig.colorbar(tpc, format='$10^{%.1f}$', fraction=0.0172, pad=0.06)
cbar.ax.tick_params(labelsize=14)

plt.savefig('test.jpg', dpi=400)
plt.show()
# print(mesh.cell_data)
注意我这里的存储路径
/Volumes/RAM Disk/是macOS风格的,Linux下面可以把临时文件存在/dev/shm/,这样可以回避外部存储,直接在内存中实现IO。 -
@田畔的风 膜大佬!研究了半晚上。几点小疑问,向您请教:
reader = OpenFOAMReader(FileName="PEE.foam", CaseType=0)- caseType=0 是控制什么的?这句导致我的case读不到任何一个时间步。删除之后可以读到。
logData = np.where( mesh.point_data['driftDensity'] < 1e-12, -12.0, np.log10(mesh.point_data['driftDensity']), )- 这句是控制什么的呢?我print(mesh.dict),发现没有‘driftdensity’
- 我用的是六面体网格,怎么划分成三角形,你的代码里有相关的吗?(我刚理解到第二个问题,后面还没看,肝不动了)
多谢分享,多谢多谢
-
-
caseType参数的作用在上一行的注释中已经给出。caseType=0指读写decompose算例,即包含processor*文件夹的并行算例。caseType=1指读写reconstruct算例,即串行或使用reconstructPar重建后的算例。 -
driftDensity是我自己写的某个求解器里的标量场的名称。在标准求解器里,你想读压力就是p,想读速度就是U,想读温度就是T... -
我的这个算例用的也是六面体网格,通过一次
slice操作转换成了四边形切片,然后对每个四边形单元进行三角化。请注意理解我的这段代码:
cell_0 = mesh.cells[0].data[:, :3]

cell_1 = np.concatenate(
    (mesh.cells[0].data[:, 2:], mesh.cells[0].data[:, [0]]), axis=1)
cell = np.concatenate((cell_0, cell_1), axis=0)

triang = tri.Triangulation(mesh.points[:, 0], mesh.points[:, 2], cell)
就是取每个四边形的
0 1 2和0 2 3两组顶点,组成两个互不重叠的三角形,然后生成matplotlib自己的三角网格。- 如果你不关心切片后的几何拓扑,可以在slice函数中设置
Triangulatetheslice=True。这个功能和paraview图形操作里是一样的,这样出来的切片就直接是三角网格了。就不需要进行上述的额外的三角化操作了。
-


